
EOS price continues its trade near the $3.660 mark after falling below the $3.580 level on the price chart for January 21. The price stayed in between the $3.620 and $3.660 marks for most of the 1-Day cryptocurrency analysis.
1-Day EOS Price Analysis (January 21)
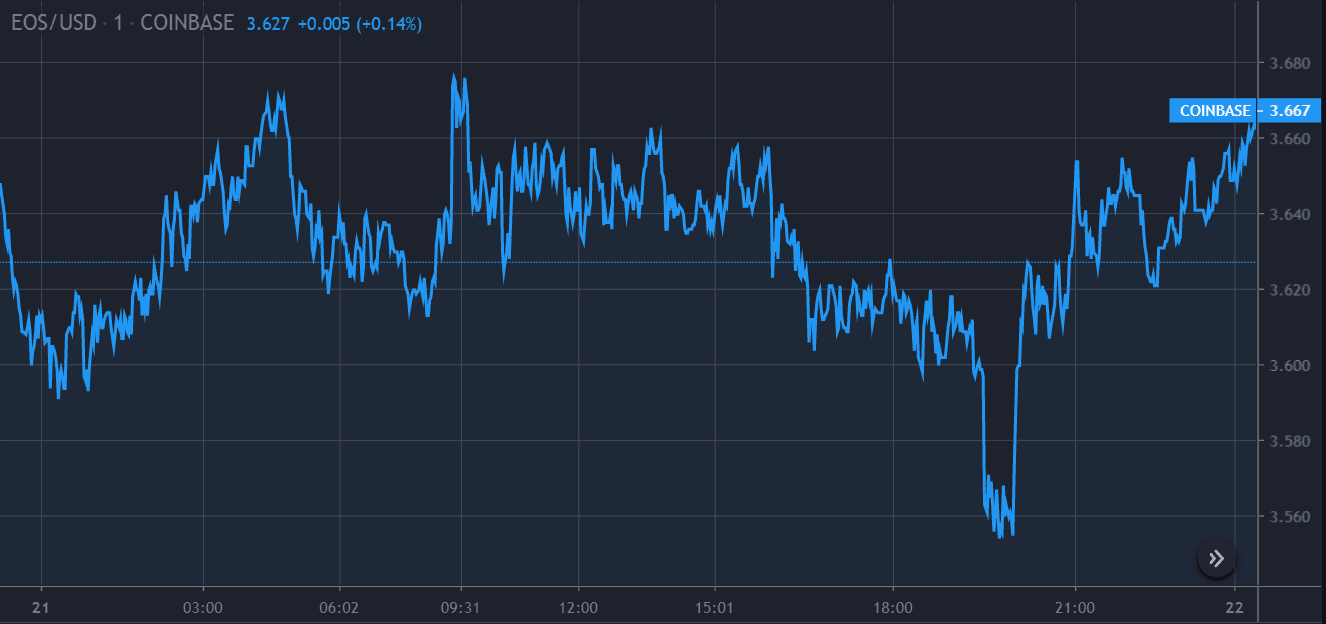
EOS Price Chart by TradingView
The coin initiated the day’s trade with a price of $3.612 US Dollars. The cryptocurrency saw all variations in price with certain ruffled movements. The price line gradually moved towards the $3.640 mark until 03:00 GMT, and then across the $3.660 mark before it retreated to be between the $3.620 and $3.640 levels on the price chart. With disheveled price movements, the trading pair continued trade between the $3.620 and $3.660 marks until 16:30 GMT, after which the price line moved between the $3.600 and $3.620 levels.
AT 19:31 GMT, the EOS/USD trading pair saw bears and saw a steep fall towards the $3.560 mark, thus marking the day’s low at $3.554 US Dollars. The coin saw a fast retracement towards the $3.620 mark by 20:09. Gradually, the price line moved towards the $3.660 mark by the end of the day, whereas it currently trades at $3.667 US Dollars.
Moving Average Convergence Divergence (MACD)
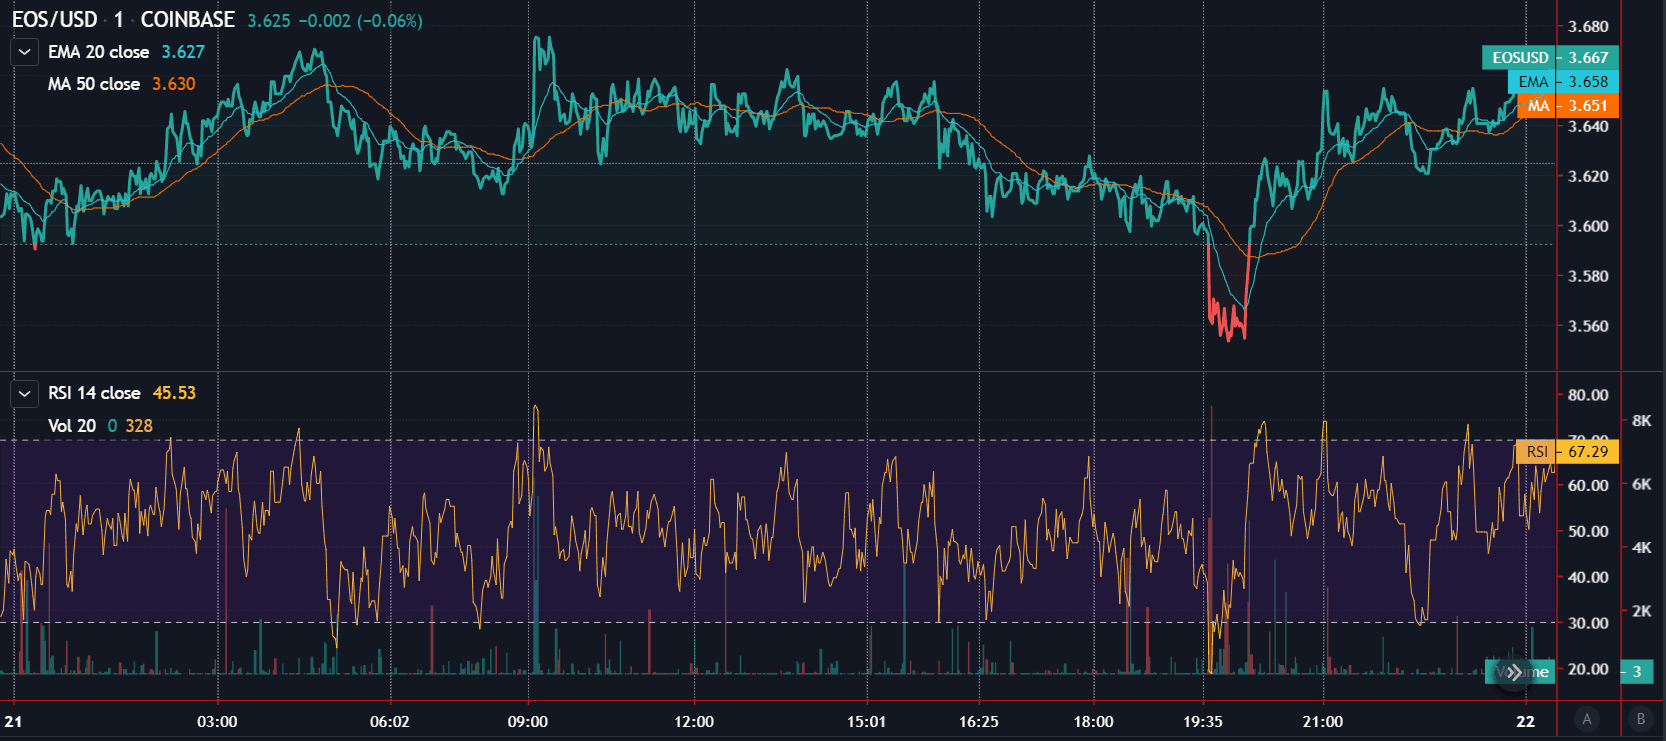
EOS Featured Price Chart by TradingView
The 20-Day Exponential Moving Average (EMA) closed at $3.658, whereas the 50-Day Simple Moving Average (SMA) stands at $3.651 mark at the end of the day.
The Relative Strength Index (RSI) stayed above level 50 for most of the day, while it currently stands at 67.29.
Featured Image by Efe Kurnaz.