
Dogecoin price analysis shows price moving into a newfound bearish pit, as price reached the lowest level since the market crash on May 12, 2022. DOGE price lowered to $0.07 during the day, undergoing a 5 percent decline from yesterday’s trade. After a week-long spell moving sideways, Dogecoin price finally fell into the bearish trap set around $0.08.
The warning signs of a continued bearish spell had been there since the price fell below the $0.1 mark on May 9, 2022, but the latest downtrend could bring some positivity for traders in the market for DOGE. Bulls are expected to pick up interest in the meme token at discounted prices, and trading volume over the past 24 hours shows exactly that with a 50 percent rise.
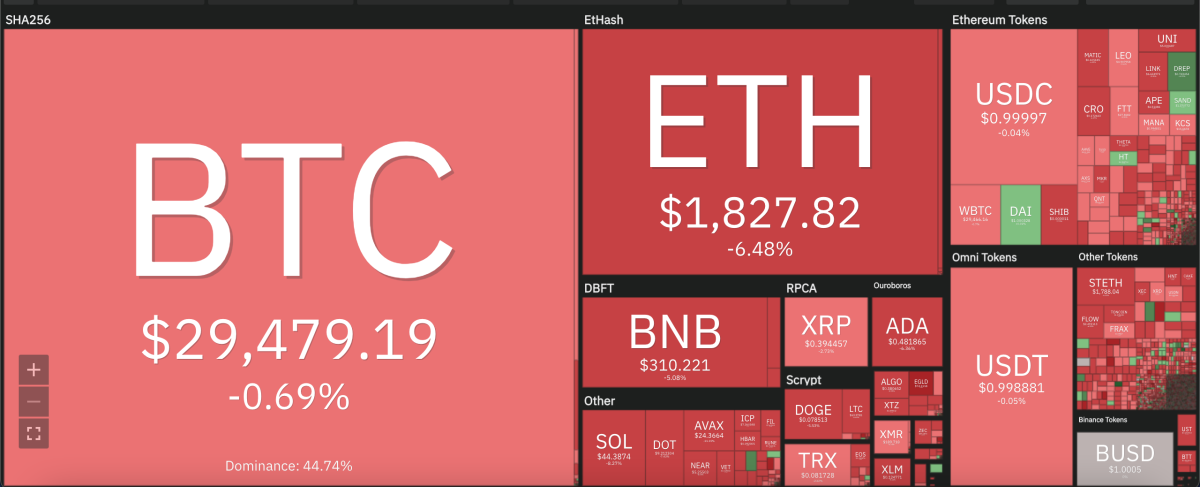
The larger cryptocurrency market suffered declines similar to that of Dogecoin over the past 24 hours, as Bitcoin failed to consolidate meaningful momentum around the $29,500 mark. Ethereum endured a significant 6 percent downfall to distance away below the $2,000 mark, while leading Altcoins showed similar reading. Cardano lowered 6 percent to $0.48, and Ripple 3 percent to $0.39. The Binance coin dropped 5 percent to move down to $310.22, whereas Solana suffered a massive 8 percent drop to move as low as $44.38. A similar downtrend was echoed by Polkadot, dropping 7 percent to $9.21.
Dogecoin price analysis: Continued movement below moving averages downs price on daily chart
On the 24-hour candlestick chart for Dogecoin price analysis, the price can be seen finding a new downtrend to move to the lowest level since May 12, 2022. The current price correction comes after continuous sideways movement, which was capped at the $0.08 mark. When DOGE could not break past this point after facing multiple rejections, the bearish momentum took over over the past 24 hours with excessive sell-offs. As a result, the price moved further below the crucial 50-day exponential moving average (EMA) which is set at $0.084.

The horizontal trend coupled with today’s dip can also be verified in the daily relative strength index (RSI) which sits within the oversold region at 31.40 and could move further downwards before picking up. In addition, the moving average convergence divergence (MACD) curve can be seen forming higher lows above the neutral zone. Over the next 24 hours, DOGE price could move down to the bottom floor at $0.06 before buying momentum is expected.
Disclaimer. The information provided is not trading advice. Cryptopolitan.com holds no liability for any investments made based on the information provided on this page. We strongly recommend independent research and/or consultation with a qualified professional before making any investment decisions